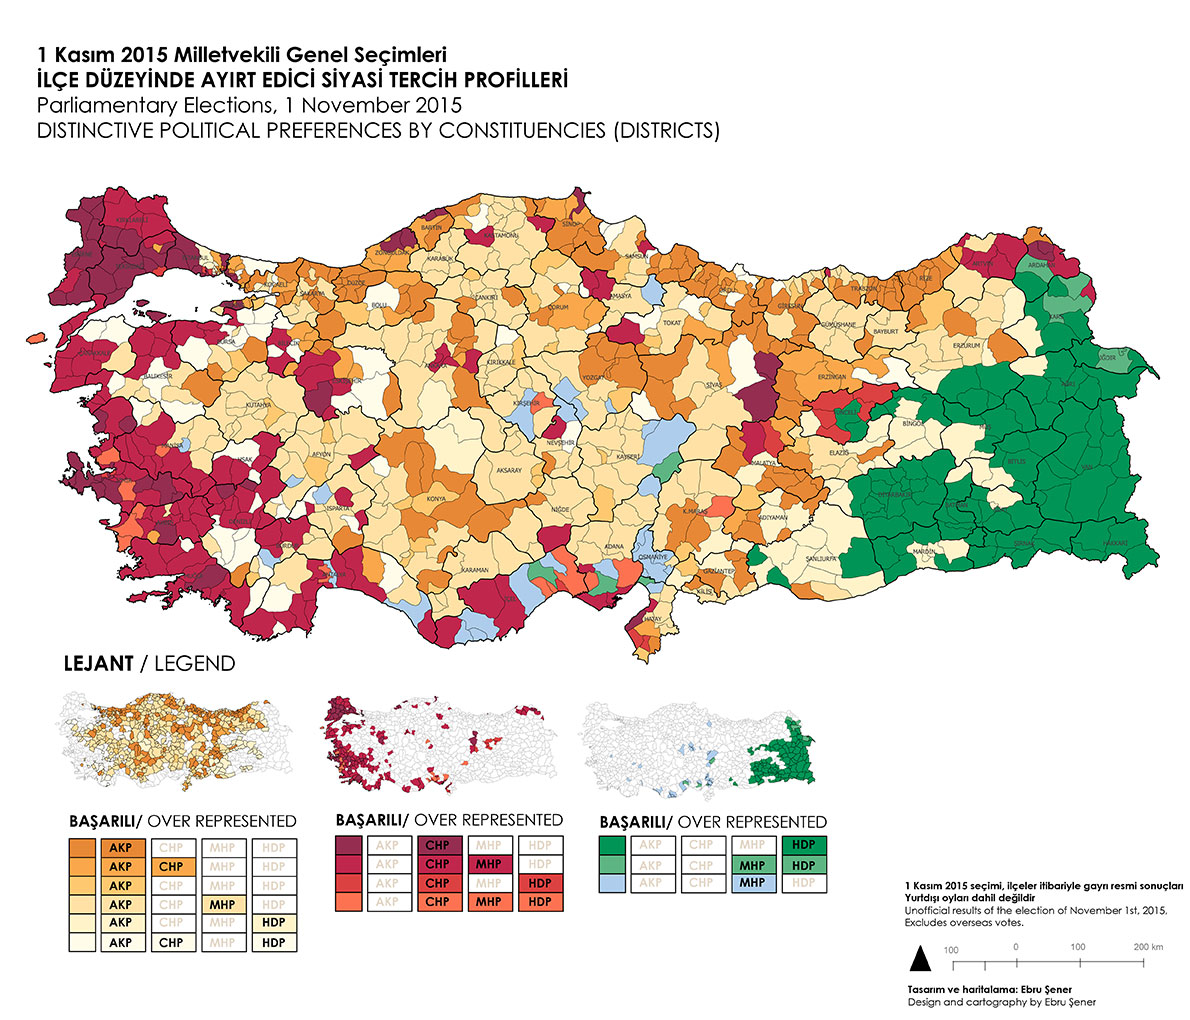
June 7 2015 Generel Election Maps:
Party Performences by Districts
Electoral maps 7th of June 2015, prepared by ISC, have been revised based on invaluable comments and critics from visitors. Revised plates depicting political party performances at district level are produced on the same site. Furthermore, you can find a synthesis map visualizing the overlap and the contrast between different electorates is available on the same site.
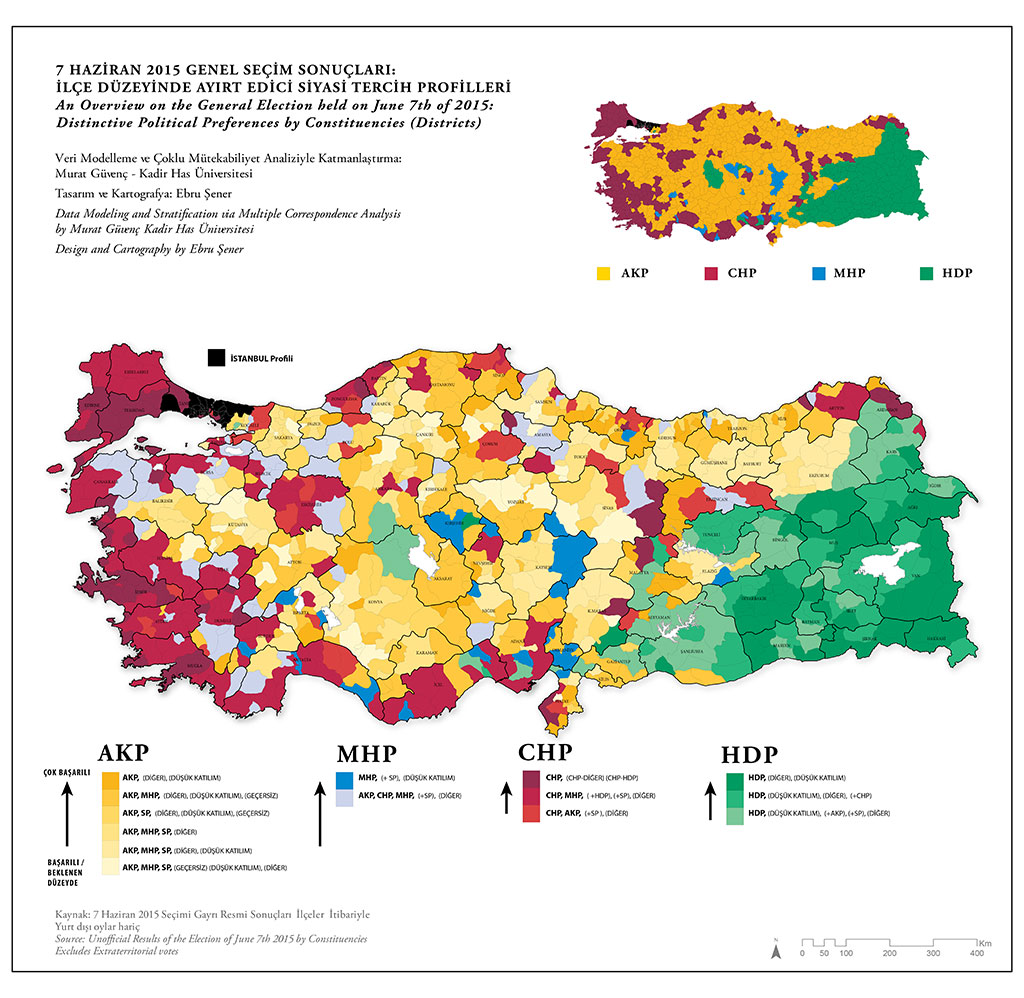
Maps of the June 7th, 2015 general elections, the press immediately published after the event have this time too failed to convey a legible and valid account of the distinctive features emerging political landscape. However, recent advances in data mining, and interactive mapping allows students to side step this rather important problem. Utilizing these new tools Murat Güvenç and Ebru Şener have prepared a series of detailed and legible electoral map series.
Maps accessible via links produced below depict electoral performances of AKP, CHP, MHP, HDP and SP by constituencies at the district. The level of local political support is measured as ratios computed with respect to total registered voters I- and not with respect to total valid votes as it is usually the case. This unconventional approach would prepare the ground for comparative analyses on electoral geography.
High resolution maps depicting political party performances, participation rates and invalid votes in the same carthographic style may help visitors to decipher distinctive aspects and dimensions of Turkey’s latest political landscape.
These interactive maps accessible through internet are hopefully expected to shed light on the distinctive cleavages and features of Turkey’s Political landscape.
High resolution maps can be seen by clicking on the blue address line located above each map.
They can freely be downloaded and used for academic purposes.
Reference:
Interactive Electoral Maps of The 7th of June 2015, M. Guvenc, Kadir Has University, Dept of Political Sciences, Director of Istanbul Studies Center, E. Sener, Independent Cartographer, August 2015.
http://www.khas.edu.tr/en/1964/e-publications
Methodological Note:
The interactive choropleth maps and the composit map conveying a legible account of different electorates are drawn with different methodologies.
Local electoral results are clustered through a k-means procedure to generate seven distinctive legend categories. The upper and lower bounds of each category are given in the key for codes.
Colors indicate deviations from the overall national performance. The political supports superior to nationwide average are shown as a graded pattern from light yellow to orange, whereas unsuccessful electoral outcomes are shown as a graded series from light to dark blue. Local data on election results, participation rates and invalid votes by chosen constituencies are derived by clicking on the map.
The maps series which where party performances can be related to participation and invalid votes are expected to yield extensive empirical data and relevant and generic research questions for further studies in electoral geography and in political anthropology.
Congruence and the contrast between electorates are displayed in the composite election map drawn through the Multiple Correspondence Analysis (MCA). This synthetic visualization is based on a model proposed by Ludovic Lebart: a particularly efficient model which makes joint use of MCA and Cluster analyses. The composite map can also be taken up as an original application of new tools of unsupervised pattern recognition and data mining to the field of data visualization and cartography. The multidimensional stratification is done through STRATA_MCA: a procedure designed by Murat Güvenç and coded by Dr. Savas Yıldırım. STRATA_MCA is actually being licencing phase.
PARTICIPATION RATES
https://ebrusener.cartodb.com/viz/b717b916-45b2-11e5-8e2e-0e853d047bba/embed_map
COMPOSITE MAP